Tag Archives: Splunk

Fix sudo being slow after changing hostname

Recently I changed the hostname of one of my machines. Ever since I did this there has been a five second pause from when I enter a command and when it actually executes. I was perplexed about this until I came across this post explaining that the /etc/hosts file was probably still pointing to the old hostname. It turns out it was!

So, to recap, if you want to change the hostname of your machine you have to make sure you do these three things:

  • issue the hostname command to change the hostname while running
  • update /etc/hostname with your new hostname
  • update /etc/hosts to reflect your new hostname after 127.0.0.1 (get rid of the old hostname.)

Update 2/24/2015: If you happen to have a Splunk forwarder installed on the machine, make sure you update its config to reflect the new hostname. Thanks to Splunk Answers for the information.  To do this, update  $SPLUNK_HOME/etc/system/local/server.conf and change the serverName= field to your new hostname.


Extract Active Directory Account Names in Splunk

I don’t really understand Microsoft’s rationale when it comes to log verbosity. I suppose too much information is better than not enough information, but that comes at the cost of making it difficult if you have to try and actually read the information.

I’ve been trying to extract usernames from Active Directory controller logs and it turned out to be quite a pain. Why do the logs have more than one field with the same name? It confuses Splunk and seems to fly in the face of common sense and decency.. I will stop ranting now.

In my specific case, AD lockout logs have two Account Name fields, one for the controller and one for the user being locked out. I am interested only in the username and not the AD controller account name.  How do you tell Splunk to only include the second instance of Account Name?

The answer is to create a field extraction using negative lookahead (Thanks to this article which gave me the guidance I needed.) I had to tweak the regex to look for and exclude any matches ending in a dollar sign, as opposed to excluding dashes in the article’s example. My fine tuned regex statement is below:

Account Name:\s+(?!.+\$)(?P<FIELDNAME>\S+)

It looks for Account Name: followed by one or more spaces (there is excess spacing in the logs for some reason.) The real magic happens in the next bit – (?!.+\$)

  • Parenthesis group the expression together
  • ?! means negative lookahead – don’t include anything you find that matches the following regex
  • .+ – one or more characters
  • \$ – stop matching when you encounter a dollar sign

The second regex string is simply \S+ (one or more non-whitespace characters.)

Note this doesn’t satisfy all AD logs, just the ones I’m interested in (account lockouts – they all have a first Account Name ending in a dollar sign.)

The result of all this jargon and gnashing of teeth: clean Splunk logs revealing only what I want without excess information. Neat.


Update: I found an even better way to do this. The key is to use the regex modifier (?s) to include new lines. The better query is now this:

(?s)(<section name of the field you're interested in>:.+Account Name:\s+)(?P<real_group_name>[^\n]+)

A detailed explanation is located here.

Make stats in Splunk more meaningful with fillnull

I mentioned in my last post about a common issue that I have with the stats command: items with empty values are simply excluded from the results. What if you want to include those empty results with the stats command?

The solution, which I found here, is to use the fillnull command.

<search query> | fillnull value=”-” | stats count by <field(s) which contain empty values>

It’s that simple! Now instead of excluding empty results, they are included and display as a dash. Brilliant.

Perform DNS lookups on Splunk fields

I recently came across a very handy command in Splunk, the lookup command. Thanks to this website I was able to learn how to use the lookup command to give me more relevant results. Instead of Splunk listing a bunch of IP addresses, it now returns a column with everything it could resolve. Seeing resolved domain names alongside IP addresses gives much more meaning to the data.

The command is as follows:

<search> | lookup dnslookup clientip as <IP Field> OUTPUT clienthost as <Resolved Hostname>
  • <search> is your original search
  • <IP Field> is the field which contains the IP addresses you want to do name lookups on
  • <Resolved Hostname> is the name of the column which will contain your resolved hostnames.

You can order your search results in a table if you do the above command before your stats or table command. The example below is to parse some firewall logs from a single source host and perform lookups on them.

<search> | lookup dnslookup clientip as dstip OUTPUT clienthost as Resolved_hostname | stats count by dstip Resolved_hostname dstport proto action

Be careful when using the stats command, though. If the IP address is local it will have a blank resolved hostname, which will exclude it from the stats table.

Splunk regex tips

I’ve spent some time playing around in Splunk trying to refine my dashboards and searches. Here is what I’ve learned (or re-learned) about Splunk and using regular expressions in your searches.

Field extraction syntax

The general formula for using regex to create field extractions is as follows:

(?i)Initial regex match(?P<FIELDNAME>Regex dictating how much to match after initial match)

Example:
(?i)Last Matched Message: (?P<message>(?:[^”]+))

This field extraction searched my logfiles for the string “Last Matched Message: ” It then kept matching every character until it reached a double quote ” and named the extraction “message”. I can now do a “| stats count by message” query in Splunk to cleanly see the values of “Last Matched Message” in my firewall logs.

Regex lookahead

The above regex string utilized a positive lookahead. The syntax for Splunk includes a question mark as expected, but also a colon for some reason (as opposed to an equal sign.) I haven’t looked into why.  Just put  (?:)  in front of your criteria (see above)

Eval

The eval parameter is handy if you want to take information in Splunk and make decisions on it, then display the results in its place. I use it to translate 6 to TCP and 17 to UDP in my firewall logs.

Example:
eval proto = case(proto=”6″,”TCP”,proto=”17″,”UDP”)

Regex: sed

You can use stream editor in Splunk just like you would in Linux. This allows you to modify the output of Splunk results, making them much more useful. The syntax is:
| rex field=fieldname mode=sed “sed syntax

Example:
| rex field=owncloud_file mode=sed “s/\&files\=/\//g”

In this example I take a field I had created (owncloud_file) and then instruct sed to search “s” then look for the string “&files” (with a proper escape character for the &), then replace that string with an equal sign. The g deletes the match so future matches can be made.

The field extraction I have for owncloud looks specifically for the output from the Files app so I can see which files have been downloaded:
(?i)\?dir=(?P<owncloud_file>(?:[^ \”]+))
The regex looks for ?dir= and then matches anything that’s not a double quote.

URLdecode

I made a few sed regex extractions to clean up URLs (replacing %20 for space, etc) when I realized there’s a much easier way to do this: the urldecode function. Simply append the following to your search:

| eval fieldname = urldecode(fieldname)

In my case all I had to do was append
| eval owncloud_file = urldecode(owncloud_file) and voila! all my results look nice and human readable. Magic.

Phew!

I think I’ll stop for now.
 

Reverse search result order in Splunk

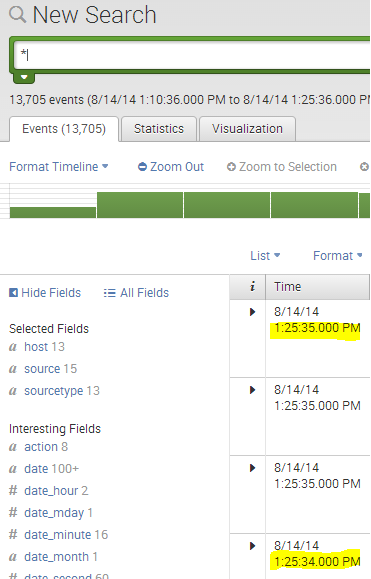
When you run a query in Splunk it returns the most recent result at the top of the screen by default.

normal

For far too long now I have been running queries in Splunk and then manually clicking back to the last page of results so that I can see the first time something happened.

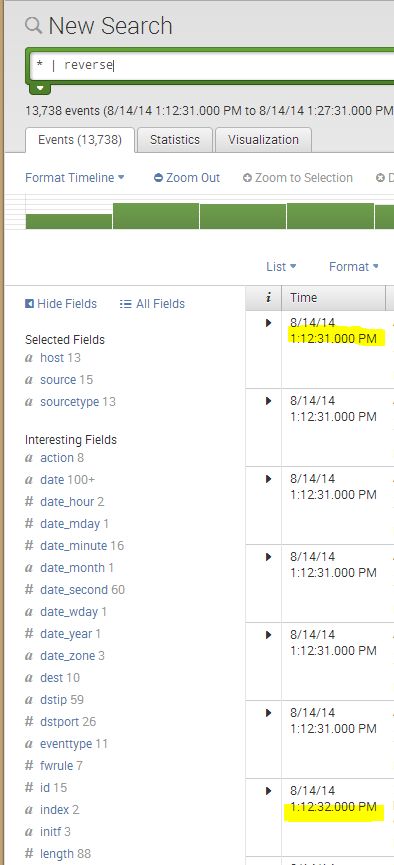
It turns out there is a better way. Simply append ” | reverse” (without quotes) to the end of your search result. This will cause the earliest search result to be at the top, rather than the most recent. Handy.

reverse